TS Terra Incognita Project #8: Neural Net Expert System
edition December, 2018
From Bradley Siderograph to Expert System
In 1947 year Donald Bradley has calculated his famous siderograph - a projection line that shows the balance between "good" and "bad" aspects calculated some special way. Also one declination component was used there. Now, in the beginning of 21st century, it is difficult to understand how it was possible to do this job without computers. A person would have to calculate aspects, taking into account orbs for these aspects and do a summation for all active aspects. These calculations would take so many days, just to see the whole picture on some significant price interval. And Donald Bradley's efforts were rewarded: his siderograph is one of the best evidence that planets move stock market somehow. I have my personal greatest respect to this guy, it was a real breakthrough.
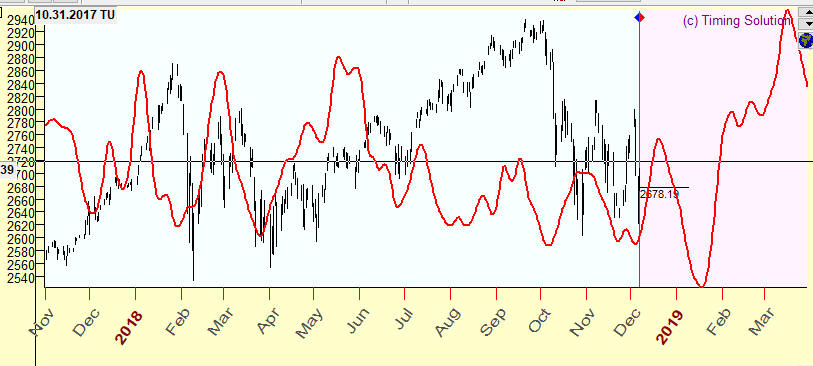
Now we can calculate a classical Bradley siderograph for 70 years of price history within some seconds. Here it is:
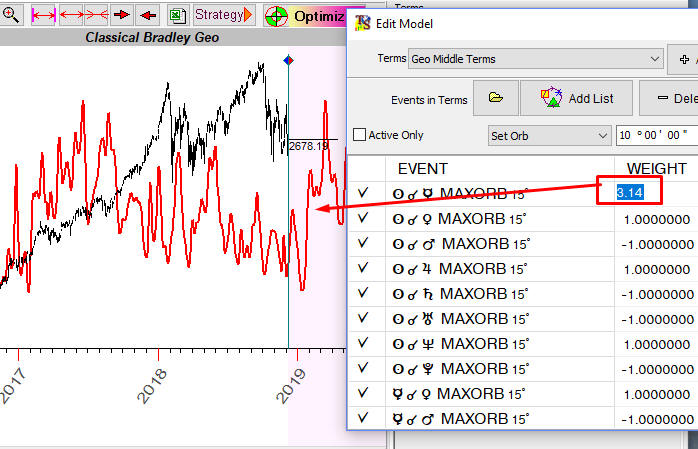
And you can easily customize your siderograph changing the weights of any aspect and simultaneously see how the siderograph changes:
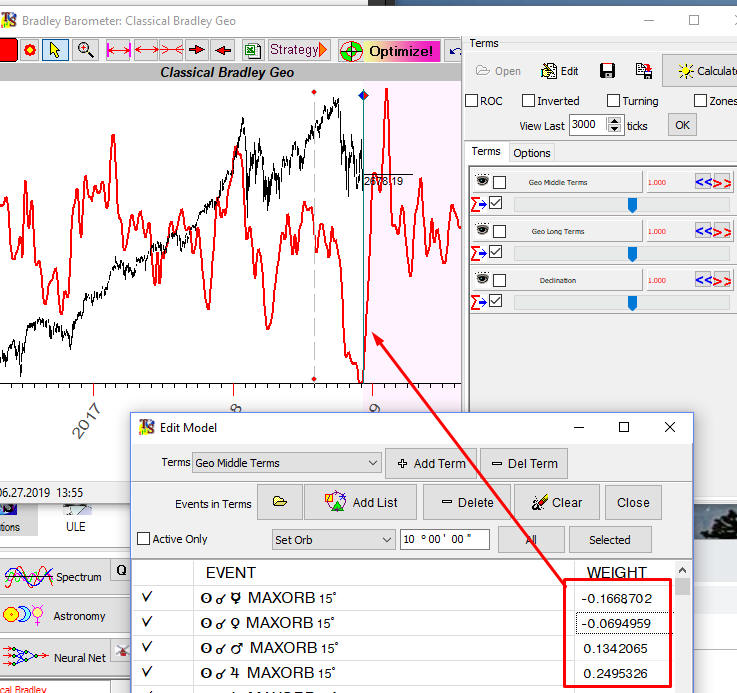
You can delegate the software the work of finding the best weights for aspects to get the better projection line, this is optimization procedure. Here the improved projection line with optimized weights:
You can apply as well more advance Neural Network technology to get a better projection line. All that is possible to do, and easy... BUT:
This idea was implemented in the 20th century. Now, in the beginning of 21st century, we need some other technological breakthrough.
Neural Network Expert System (NNES) might be the answer. It works in a different way. Suppose we need to create a projection line for some financial instrument; let it be APPLE (EOD chart available since 1980). The question arises: what model should we use to create this projection line? Following the steps of Donald Bradley in 1947, we can generate a projection line that is based on planetary aspects. We can do it with classical aspects. Or, going beyond Ptolemy aspects, we can take into consideration all angles between the planets (it is done by FAM model of Timing Solution). We can add to our research many other things: planetary phases, waxing/waning aspects, planetary speed, declination and other phenomena ... How many models should we consider? One? Two? A hundred? Which one or ones? To get the answer to these questions, we used to run Neural Network module for different models, one at the time, calculate projection lines based on those models and then decide what projection line works better for our financial instrument. The major problem here was dealing with too many variations, as we had had to keep in mind all projection lines created by all these models.
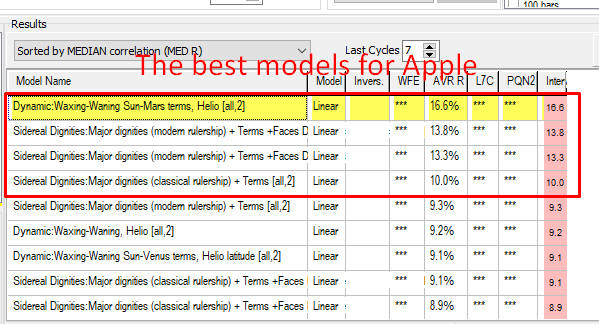
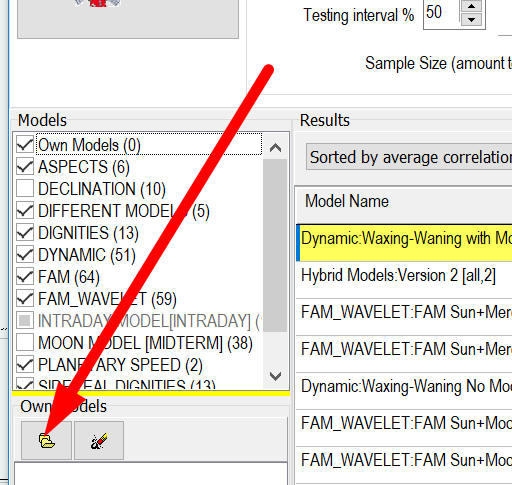
NNES analyses hundreds of different models, conducts Walk Forward Analysis for these models and finds the best models for some financial instrument. Let us look closer at the example mentioned above. We have started with downloading APPLE price history. Then run NNES, and in two hours we get the full picture regarding the most suitable models for APPLE:
This is not just a calculation of a bunch of models. This is a complete research where we analyze many models and compare them.
Permanent versus Dominant models/cycles
Before running this module, please download and install "Forecast Mill" library. This library can be found in User Area section of our website. Or you may use this direct link:
http://www.timingsolution.com/TS/User_Area/ts_astro_experts.zip From time to time we add new models, so it is recommended to update this library.
Before starting to use this module, let us discuss the difference between permanent and dominant models/cycles. Permanent models are the models that work all the time in the same manner. For example, we can say that Annual cycle works: in December the price tends to go up (Christmas rally). This is the way how Annual cycle works, and it works the same way now as it has worked 10, 20 or 50 years ago. When we speak about permanent cycles, we assume a presence of some stable patterns, patterns that work the same manner all the time.
Astro cycles can also work in a different way. The pattern formed by these cycles may change with the time. The planetary cycle may work now differently than it has worked 10 or more years ago. The cycle still works, but in different periods it works in a different manner.
To reveal permanent and dominant cycles, we have to apply different procedures. To reveal permanent cycles, we separate the existing price history on two parts: in sample (the price history that is used to build a model) and out of sample (a part of the price history to verify this model; it is also called "a testing interval"). The better model forecasts on the testing interval, the better model we have.
To reveal dominant cycles, we apply Walk Forward Analysis (WFA) procedure; it is explained here: http://www.timingsolution.com/Doc/level_2/WFA/index.htm
This procedure requires more computing time because the program tries to find out how this model is changing in time.
Neural Net Expert System (NNES) allows to reveal both permanent and dominant models.
Revealing Permanent models
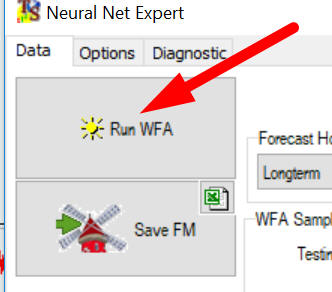
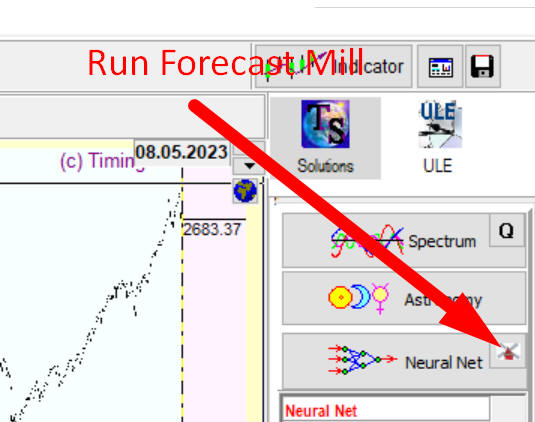
Now there is in TI section "Neural Net Expert System" module:
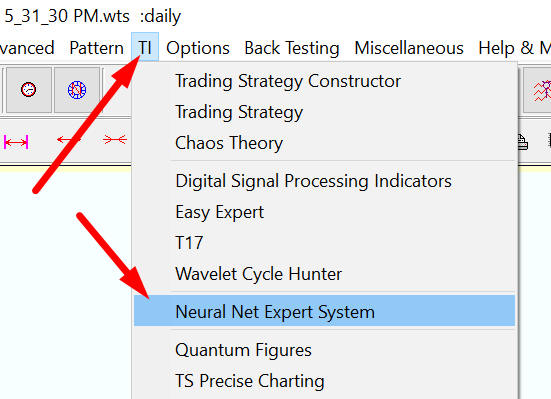
Please open it and click "Run WFA" button there. By default the program analyses permanent models (we may apply WFA for permanent cycles if we consider the sample size equal to 1); here you can choose a backtesting scenario for a certain type of cycles being analyzed:
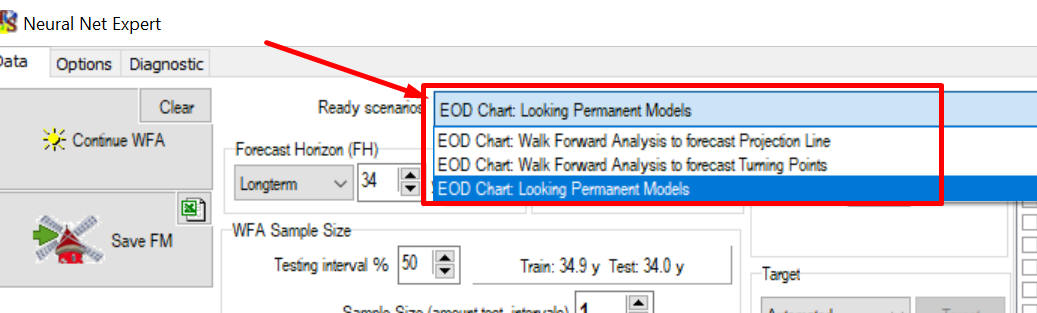
Choosing one of these backtesting scenarios, the program automatically sets optimal parameters for the available price history.
To reveal permanent cycles, the program divides price history on two equal intervals (approximately) and watches how the projection line based on analyzed models forecasts the price history on the testing interval:
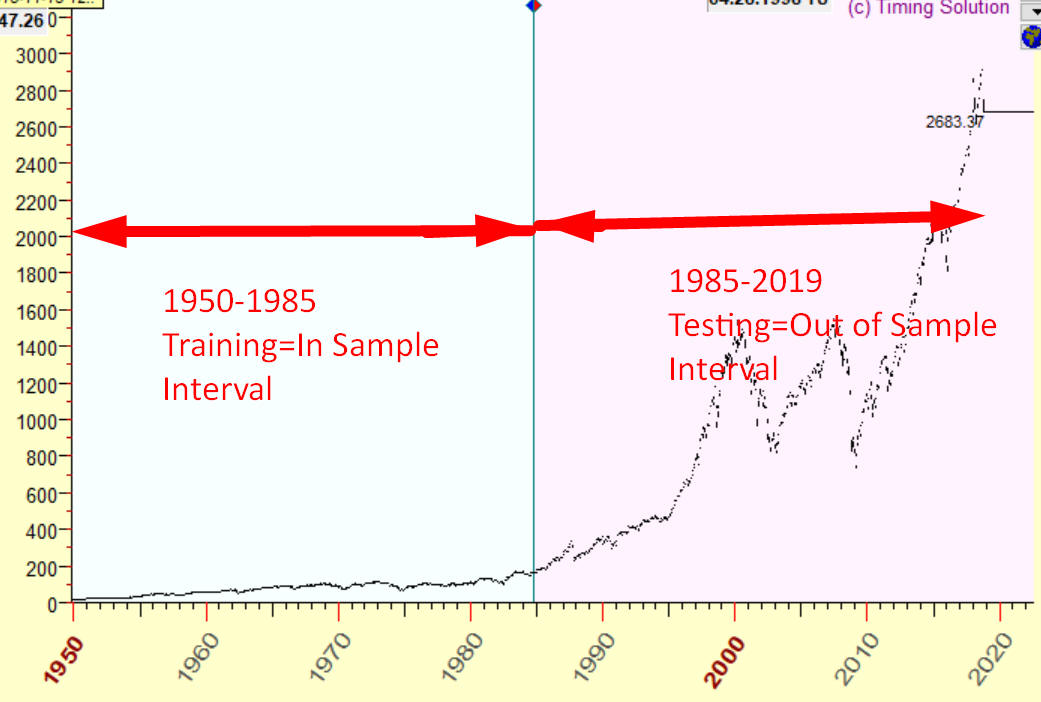
In this example we use price history since 1950 till the end of 1985 to optimize/train our model. After that we use price history since 1985 till the end of 2018 to check how the projection line based on this model forecasts the price movement. In this case we use ONE sample size, one testing interval.
To run backtesting procedure, click "Run WFA" button:
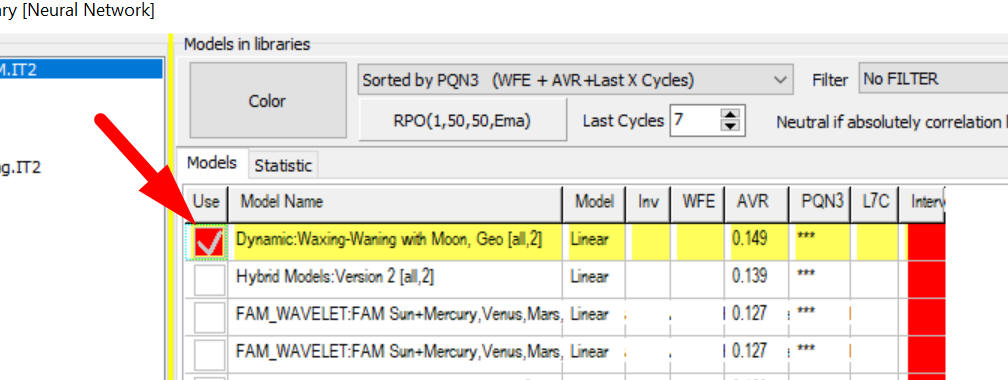
We are running now Neural Net Expert System (NNES). The program analyses more than 200 different models. Finally after 4-6 hours of calculation we get a list of rated models, the models that provide the best forecast on the testing interval (since 1985 till the end of 2018):
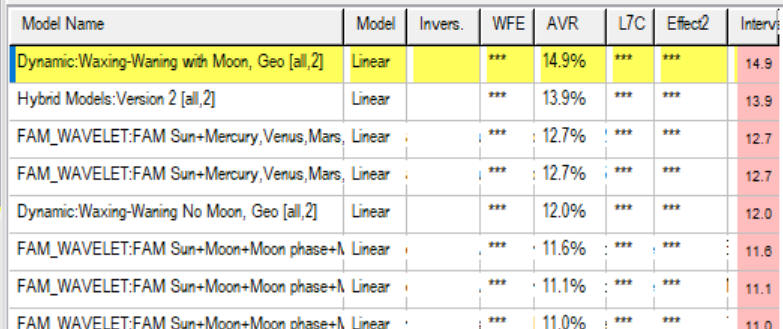
The first model: 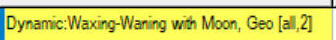 provides the
correlation 14.9% between the projection line and the price on the testing
interval since 1985 till the end of 2018.
provides the
correlation 14.9% between the projection line and the price on the testing
interval since 1985 till the end of 2018.
Forecast Mill (FM) library
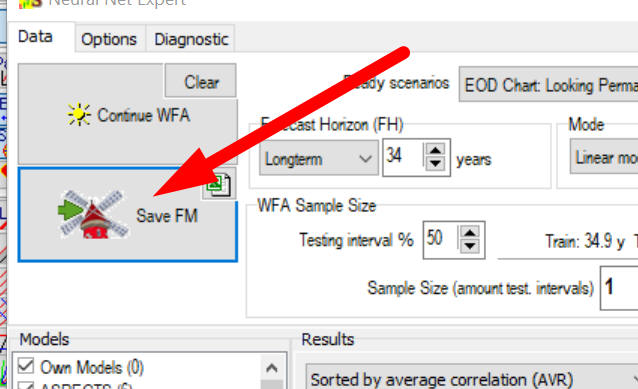
When the calculation is finished, the results can be saved to Forecast Mill (FM) library:
These saved models can be used any time later, by clicking this button in the Main Screen:
Choose there your model/models and build a projection line/lines based on this/these model/models:
Revealing Dominant models - Walk Forward Analysis (WFA)
To reveal dominant models/cycles, we have to apply several different out of sample intervals. The amount of those out of sample intervals is called SAMPLE SIZE. In this example the sample size=10:
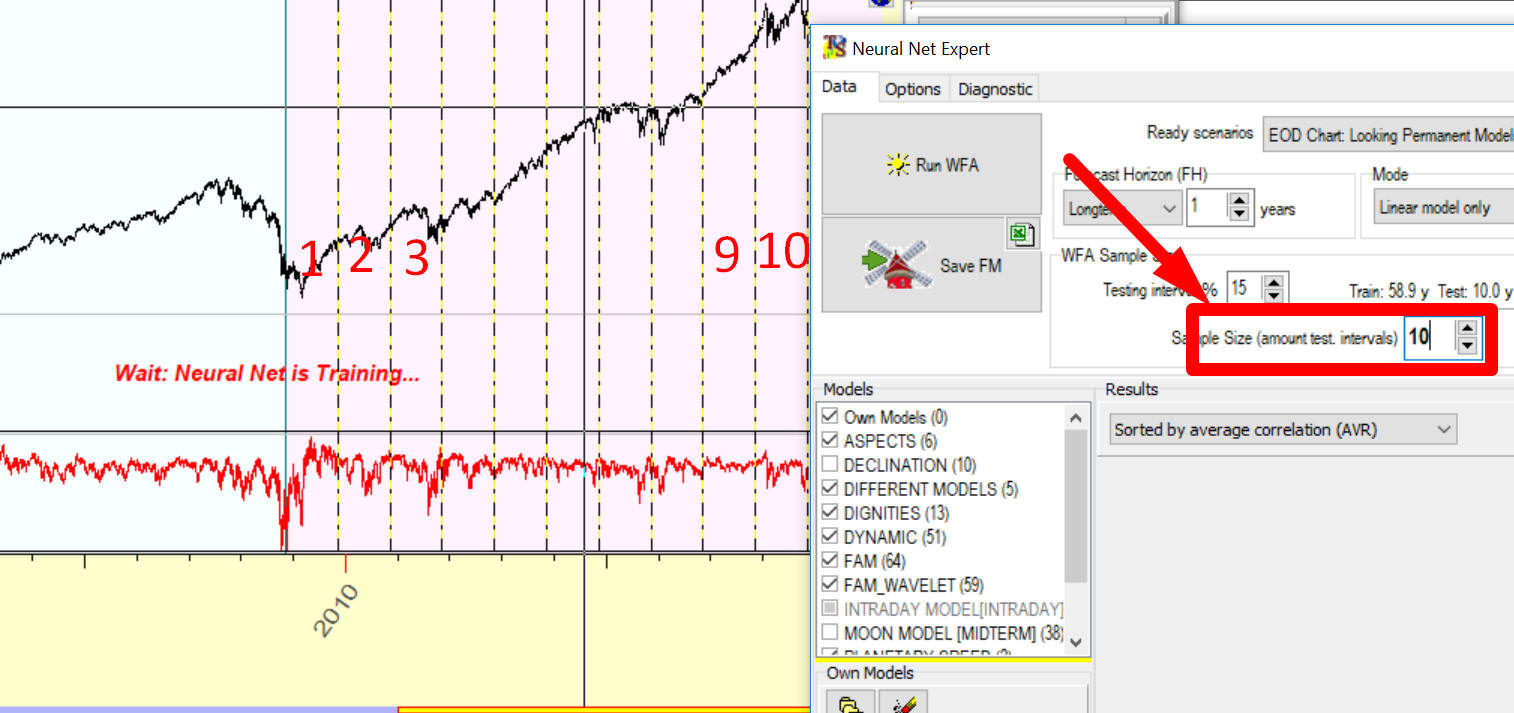
Here is how it works: the program sets LBC position to the end of 2008, trains the Neural Net (using price history prior the end of 2008), calculates a projection line and watches how this projection line forecasts the price on the very first out of sample interval, from the end of 2008 to the end of 2009. After that the program sets LBC to the end of 2009, trains the Neural Net on the new set of data (the price history prior the end of 2009) and watches how this projection line works on the second out of sample interval (the end of 2009 - the end of 2010). Then the LBC is moved again. The whole procedure is repeated 10 times gathering the statistic information regarding how this model works on out of sample intervals. The results are presented in a table where red and blue bars show how the projection line forecasts future price movement on these out of sample intervals:
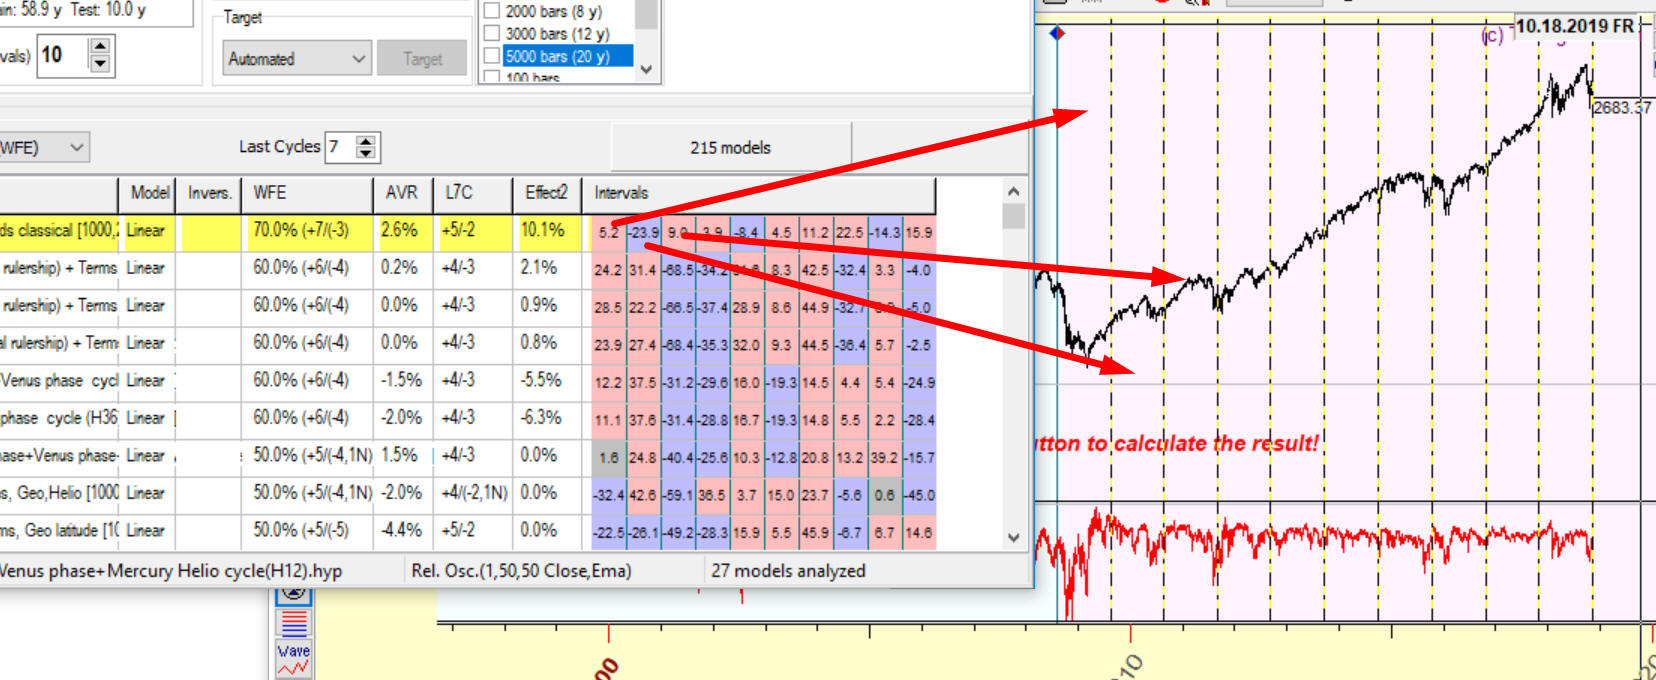
The first red bar with digits 5.2 shows how this model forecasts future on the first out of sample interval (the end of 2008 - the end of 2009): the correlation between the projection line and the price on this interval is 5.2%.
The second blue bar shows how this model works on the second out of sample interval (the end of 2009 - the end of 2010); the correlation here is negative -23.9%.
Thus you can see how this model works on all out of sample intervals.
WFE - walk forward efficiency, the percentage of out of sample intervals with a positive correlation; in this example 70% out of sample intervals have a positive correlation (7 red bars versus 3 blue bars).
Median correlation for all these out of sample intervals is positive 2.6%. Therefore you get a complete statistical information regarding the analyzed model: a percentage of good intervals where the forecast is good (WFE-walk forward efficiency) and median correlation. The higher WFE and median correlation means the better quality of the analyzed model.
More information regarding statistical parameters for verification of projection line can be found here: http://www.timingsolution.com/Doc/level_2/WFA/index.htm
You may use Projection Quality Number (PQN3) parameter to estimate the quality of projection line. If PQN3 is higher than 10%, the projection line can be considered as a good one.
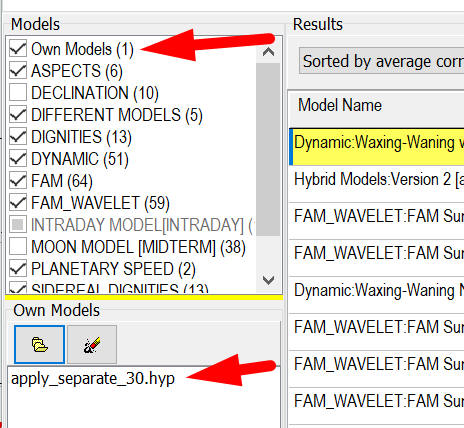
Creating your own models
To create your own model, you have to create first the events file (*.hyp extension). You can do it using Model Editor: You can run the model editor this way:
You can also create the model through Neural Network module and save it into a file using this button:
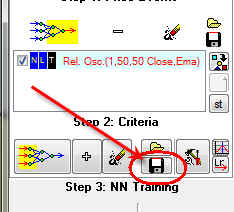
Saving this file into any folder you can add it to Neural Network Expert System clicking this button:
As you see, the file with this model appears in this list: